
PHEV: Real-world consumption 2-4 times higher than approved
Plug-in hybrids have been losing their allure as bridges to a new era of clean transport with many analysis finding real-world consumption and CO2 emissions far from type-approval values. Fraunhofer ISI and the ICCT just prove this to hold globally and across models.
In their study published today, the researchers evaluated over 100,000 PHEVs in the world’s major markets. The teams at the institutes managed to put exact numbers behind the real impact of driving a plug-in hybrid vehicle in North America, China, Germany, Norway, and the Netherlands.
The white paper, tellingly titled “Real-world usage of plug-in hybrid electric vehicles – Fuel consumption, electric driving, and CO2 emissions,” finds PHEVs real fuel consumption and CO2 emissions two to four times higher on average than in test cycles such as NEDC or WLTP. Policymakers use these test values to denote the climate impact of vehicles across fleets and lastly to shape policy.
The broad span of two to four times higher is easy to explain – the Fraunhofer Institute for Systems and Innovation Research ISI and the non-profit research organisation International Council on Clean Transportation (ICCT) extracted different use cases from the extensive material.
In total, the analysis included 104,709 plug-in hybrids in private and corporate use. In the case of company cars, fleet operators provided some data. Other usage data were extracted from portals such as Voltstats in the US, Spritmonitor in Germany or Xiao Xiong You Hao in China, where vehicle owners voluntarily provide anonymised consumption data. Results of previous surveys, such as the UC Davis field trial, were also taken into account.
The majority of the sample from primary and secondary sources came from the USA and Canada (84,068 data sets). For China, the institutes investigated 6,807 PHEVs in private use, and the Norway sample still included 1,514 private cars. Data from 10,800 Dutch company cars made it into the study, while in Germany the figure is 1,385 private cars and 72 company cars. According to Fraunhofer ISI, the data covers 66 different PHEV models and 202 model variants.
“Although the sample is dominated by North American vehicles, the sample sizes for individual countries are still sufficiently large to discern general patterns and draw conclusions,” the researchers say.

The data was also enough to reveal differences as real-life consumption and standard consumption differs from country to country. Dutch company car drivers cover a broad spectrum of varying consumption values – the deviation is between 100 and almost 700 per cent, with a peak at around 450 per cent. In Norway, private customers use their PHEV more uniformly. Here, the largest deviation is at precisely 200%, but the range is only between roughly 160 and 230 per cent. In the US, the peak is similar to Norway but shows more considerable variations. The evaluation also indicates that it is secondary whether the NEDC or WLTP test cycles apply as the deviation between standard and real consumption is “about the same,” as the paper shows.
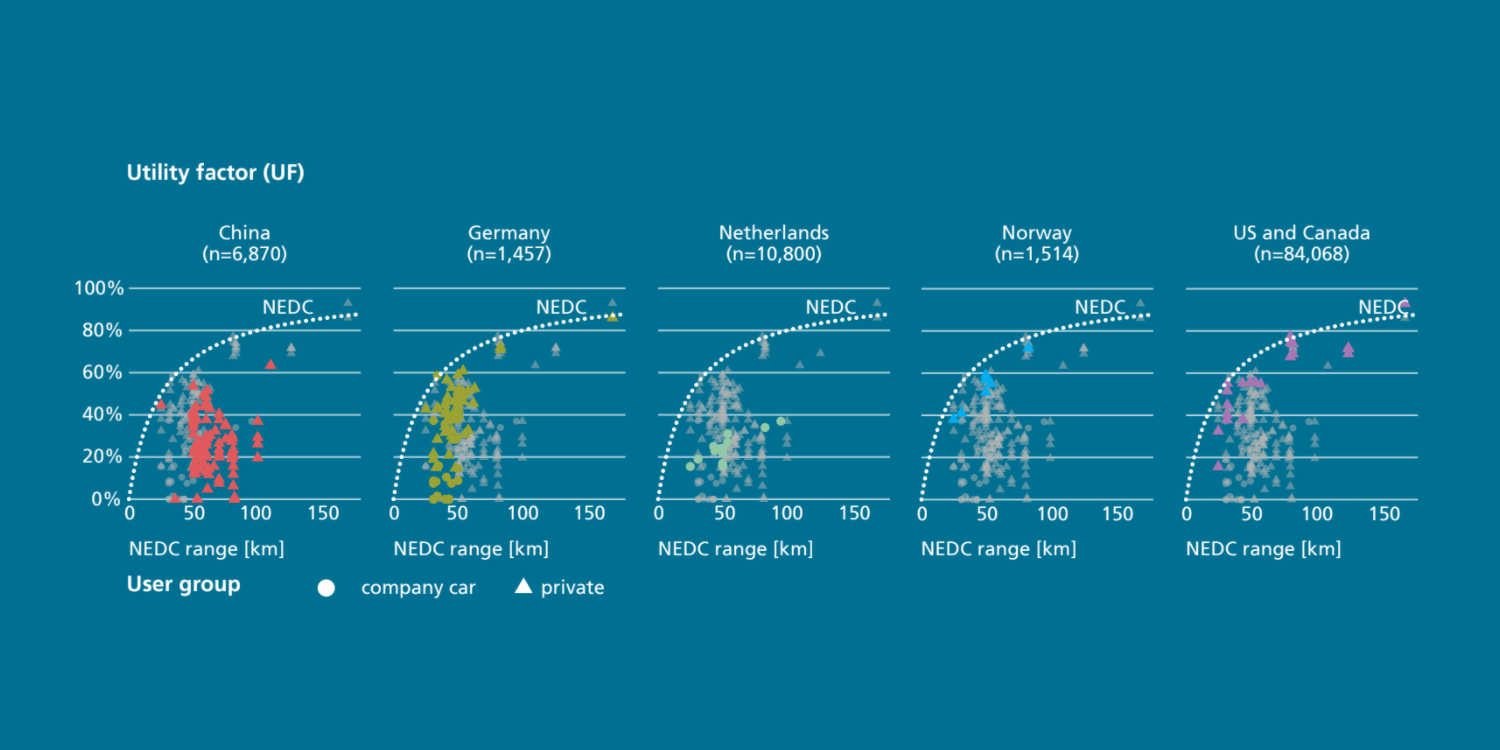
Another indicator of the difference between standard and actual consumption is the average distance driven in electric mode, known as the utility factor or UF. The researchers found the average real-world share of electric driving for PHEVs about half the share considered in testing cycles. The average UF of private cars is 69 per cent for NEDC type approval but only around 37 per cent for real-world driving. For company cars, the average UF of 63 per cent for NEDC decreases to about 20 per cent for real-world driving.
Fraunhofer and ICCT stress “noteworthy differences between the markets” also in this segment. Norway and the USA have the highest real electric driving shares of the countries considered, at 53 per cent and 54 per cent respectively, both for private vehicles. In Germany, the average UF for personal plug-in hybrid cars is 43 per cent, while in China it is only 26 per cent. For company cars, 18 per cent in Germany is similarly low as the UF of 24 per cent in the Netherlands.
To explain, the team considered different starting positions in the markets. In China, for example, the low share of real-world electric driving lays in adoption. In the past, private customers often only opted for a New Energy Vehicle (PHEV, BEV or FCEV) because they could register their lower-emission car immediately rather than joining long waitlists for a license plate for a conventional vehicle. So electric driving was secondary to registration when opting to buy partially electric.
Charging behaviour reflects the same effect as a low charging frequency reduces the share of kilometres driven on electricity. So the low UF for PHEVs in China also indicates low charging frequency, which the researchers account to a lack of access to private charging opportunities. PHEV drivers in Norway and the United States, in contrast, plug-in their hybrids most often. Private users in Germany charge their PHEVs on average on three out of four driving days. For company cars, charging takes place only about every second driving day.
In Germany, of course, the environmental bonus and current company car taxation are keys to PHEV adoption. Here, too, access to a charging facility is decisive for consumption in daily life. Private users in Germany statistically charge their plug-in hybrid vehicle on only three of four days. At the same time, the high proportion of fossil-fueled driving is not only due to a lack of charging facilities or discipline but also to their use. While Norwegian and American private customers charge their PHEVs very regularly and thus often drive purely electrically, the evaluation shows that company cars, especially in Germany, are used more or less just like their combustion engine counterparts.
The researchers conclude that German PHEVs, in particular, are used more frequently over long distances because of their high mileage (private and commercial) and thus per se have a lower electric driving component (UF) in proportion.
Also, the Netherlands had high incentives for PHEVs as company cars from 2012 to 2016, leading to a substantial sales increase in PHEVs. The study notes that the Dutch government did not incentivise company car charging at the same time. Instead, many PHEV company car users in the Netherlands still have fuel cards that allow free refuelling, while they have to pay privately for charging their PHEVs at home. Because of these common financial disincentives, many PHEV company car users did not frequently charge their PHEVs, resulting in remarkably low UFs.
Combining the utility factor and the annual mileage also yields interesting figures. The German private PHEV drives 9,008 kilometres of its 20,950 kilometres with a utility factor of 43 per cent purely electrically. The company cars with their 30,200 total kilometres and the low utility factor of 18 per cent result in only 5,436 electric kilometres. And this is an entirely different environmental impact than the “environmental bonus” in Germany assumes.
There’s also a correlation between battery size and UF as electric mileage driven and is roughly the same across countries. “Most PHEVs have type-approval all-electric ranges of 30 km to 60 km (NEDC) and electrify 5,000 km to 10,000 km a year, increasing with range,” says the Fraunhofer ISI factsheet. Correspondingly, “PHEVs with high all-electric ranges of 80 km or more achieve 12,000 km to 20,000 km in annual electric mileages”.
Their findings led to Fraunhofer and ICCT making concrete recommendations for policymakers on the European level. The researchers want to see real-world usage data to make their way into policies. For example, “the CO2 emission threshold for super credits should be lowered.” Likewise, a specific PHEV model’s eligibility for subsidies should hinge on real-world usage data, for example, collected from on-board fuel consumption meters, the researchers recommend. They add that starting at base, testing procedures for PHEVs, and UF assumptions in the WLTP test cycles require an update to better reflect real driving and usage patterns.
On the national level, ICCT Director Peter Mock also recommends linking support such as purchase premiums and reduced company car taxation to proof of predominantly electric use in real-world operation. Correspondingly, legal and financial obstacles to home charging stations must give way. At the same time, fleet PHEV incentives could be issued only to companies that provide a sufficient workplace charging infrastructure or support employees in-home or public charging.
And then there are vehicle manufacturers that could do more to help make PHEVs look better on the road. The researchers recommend “Vehicle manufacturers should increase the all-electric range of their PHEVs from an average of about 50 km today to a level of about 90 km in future years.” Apart from increasing the actual electric range, Fraunhofer ISI and ICCT propose to “limit the power of PHEV combustion engines” to encourage driving in zero-emission mode. In other words, it is to build hybrids that rely on electric diving first with the combustion engine coming in as a backup at best.
Lastly, fleet managers should similarly incentivise frequent charging of PHEVs, after an assessment of driving behaviour, for example, by allowing unlimited charging while reducing the budget on a company fuel card. Instead, they should allow employees to recharge plug-in hybrid vehicles easy, quickly, and cost-effectively.
factsheet, white paper (both ICCT and Fraunhofer ISI)
Additional reporting by Sebastian Schaal, Germany.

0 Comments