How much CO2 does battery production really emit?
It is well known that electric vehicles emit more CO2 equivalents (CO2e) during production. It is equally clear that they quickly offset this “CO2 backpack” thanks to their far cleaner operation. The exact turning point depends on the source of electricity — the greener, the better. In a comprehensive lifecycle analysis, the ICCT stated in July that, on average, an EV balances out its emissions after 17,000 kilometres. Every kilometre thereafter expands the EV’s climate advantage over a combustion engine.
While the ICCT provides a market-wide perspective using average figures, BMW just published precise numbers for a specific model: when the new iX3 50 xDrive is charged using the European electricity mix, the carmaker reports that it reaches a lower CO2e output than a comparable combustion model after around 21,500 kilometres (WLTP consumption). If the electricity comes exclusively from renewables, such as an on-site solar installation, the break-even point is reached after just 17,500 kilometres.
How much CO2 does the battery cause?
However, these figures cover the entire vehicle, including factors like driving efficiency, raw material sources, and overall vehicle production — not just the battery. So where exactly does battery production emit CO2? What steps can reduce emissions? What improvements can the industry make? And where can consumer choices play a role?
Some answers come from the P3 consultancy whitepaper “Building the Sustainable EV: Breakthroughs in Battery Tech and CO2 Reduction.” The battery team, led by Joscha Schnell, analysed the main emission sources along the value chain — from raw material extraction through production to recycling. According to P3, they identified “opportunities for significant reductions.” Put simply, optimising the processes could cut battery production emissions from around 55 kg CO2e/kWh to roughly 20 kg CO2e/kWh.

However, how was this figure calculated? To calculate the product carbon footprint (PCF), P3 first determined the scope “by defining precise system boundaries and a functional unit that represents the product’s core performance,” as stated in the white paper. This includes all phases from raw material extraction, manufacturing, distribution, use and disposal at the end of the product’s life cycle. “Data collection is crucial, drawing from both industry databases (secondary data) and supply chain partners (primary data). For complex products like batteries, primary data is especially critical and is required for specific components by the EU Battery Regulation carbon footprint calculation methodology for EV batteries,” according to P3.
The biggest factor: cathode materials
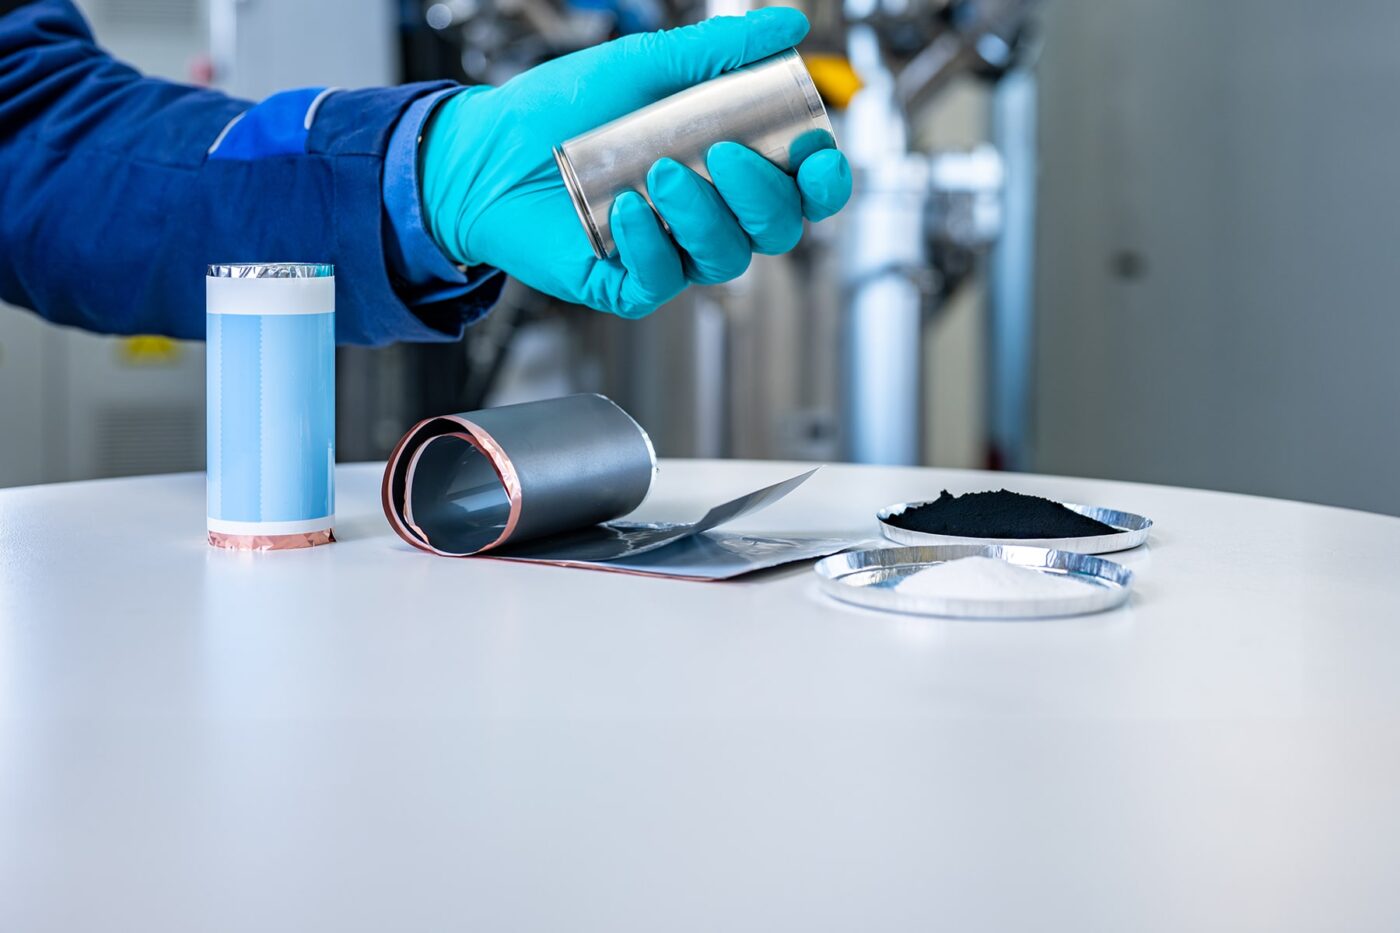
Let’s start with the largest CO2 emitter in the battery value chain: the cathode material. P3 focused on the two currently most relevant materials in the battery industry: lithium iron phosphate (LFP) cells and lithium-ion cells with a nickel, manganese, and cobalt mix in an 8:1:1 ratio — the NMC811 chemistry. The whitepaper notes: “Although both LFP and NMC811 are essential for battery production, they differ considerably in terms of sustainability and environmental impact.”
Differences appear already in the raw materials and supply chains. LFP cells, for instance, require only lithium carbonate from Chile and iron phosphate from China, whereas NMC811 cells need lithium hydroxide and nickel from Australia, cobalt from the Congo, and manganese from southern China, all transported to a processing plant in China. Differences also arise from processing energy: lithium hydroxide for NMC811 comes from energy-intensive ore processing, whereas lithium carbonate for LFP is extracted from South American salars using solar energy.

Cathode production processes also diverge. For NMC811, nickel, manganese, and cobalt are blended precisely and combined with lithium hydroxide. Two calcination steps follow to enhance material stability before it moves to the battery plant. LFP cathodes undergo a simpler process: lithium carbonate is mixed with iron phosphate and another carbon source and calcined once.
The energy demands of NMC811 vs LFP differ sharply. P3 reports a PCF of 38 kg CO2e/kWh (28 kg CO2e per kg of cathode material) for NMC811, versus 15 kg CO2e/kWh (7.5 kg CO2e/kg) for LFP — around 60% lower. A caveat: “The higher energy density of NMC811 material reduces the influence of the non-CAM components on cell level, as their impact is distributed over more stored energy. In contrast to the results on material level, NMC811 can achieve a lower overall PCF on cell level than LFP.”
Renewable energy use in processing and the supply chain can further reduce CO2. Fully renewable energy could cut the PCF by 37% (NMC811) and 33% (LFP). Using clean energy across the upstream supply chain could reduce NMC811’s PCF by an additional 38%.
Production processes matter
Once cathode materials are ready (optimally CO2-reduced), the next major area is cell production. P3 used two approaches to assess CO2e emissions in the battery plant: first-hand data from their battery gigafactory database and scientific literature. Both sources show that energy consumption per Wh decreases with production scale. Larger factories thus consume less energy per cell, highlighting the benefit of building fewer large plants rather than many smaller ones.

Before cell assembly, cathode material must be coated onto the current collector foil. P3 compared conventional wet coating with modern dry coating. In the first case, the cathode materials are mixed with binders and other chemicals to form a paste, which is then applied as thinly and evenly as possible to the carrier foil (usually made of aluminium in the case of cathodes). In the next step, the coated cathodes are dried again in large ovens to evaporate the liquid binders. Not only do the ovens require a lot of energy, but so does the treatment of the evaporated binding agents and the environment: everything must be done under clean room conditions. With the dry coating process, all of this can be skipped. It is therefore not surprising that the P3 analysis shows up to 50 per cent lower energy consumption for dry coating.
However, the PCF of the final product can be up to 5% higher with dry coating due to the use of PTFE binders, , which many people know under the brand name Teflon. The PTFE provides the necessary bond between the particles. However, the production process for PTFE releases fluorinated greenhouse gases, which have a greenhouse gas potential approximately 12,000 times higher than CO2. Some manufacturers are already working on processes to reduce the carbon footprint of PTFE production – in which case dry coating could be an advantage in battery production.
P3 emphasises: “While process innovations such as dry coating can significantly cut emissions, the most impactful strategy for reducing the carbon footprint of battery cell manufacturing lies in transitioning to renewable energy sources.” Optimising plant energy, binders, and processes alone could lower PCF from 54.5 kg CO2e/kWh to 49.9 kg CO2e/kWh, excluding upstream supply chain measures.
Untapped potential in production machinery
P3 has investigated another factor in battery factories that has received little attention to date: the production machines themselves. “Currently, no publications detail the carbon footprint data for the production machinery and facilities used in LIB cell manufacturing. However, given the increasing pressure on automakers and suppliers to enhance CO₂e transparency along the value chain and the potential impact of an extended Carbon Border Adjustment Mechanism on production equipment this analysis is timely,” the white paper states.
For this analysis, P3 examined the CO2e footprint of a tandem coating plant. The coating machine is capable of processing 700 mm wide foil at 50 m/min over eight years with an output of 2.2 GWh/year. To this end, the components of the machine were individually checked for weight and material – from large assemblies such as the rollers and housing to the servo motors and small parts such as sensors and seals. The result: using primary raw materials, the machine’s footprint is about 65 tonnes CO2e; with recycled materials, it drops by at least 30%. The largest contributors are electronics, the drying housing, and rollers.The rollers, for example, are often made of aluminium or chrome-plated steel, which is relatively energy-intensive.
If we add up these detailed analyses not only for the coating line but also for the other components of the hypothetical 2.2 GWh production line (including notching, stacking/winding and cell forming), P3 arrives at 3.7 megatonnes of CO2e emissions for this production line in its white paper. That sounds like an enormous amount, but with high plant utilisation over the eight-year term, it ultimately amounts to “roughly” 0.2 kg CO2e/kWh. “For the PCF of a battery cell, this is relatively minor compared to the CO2e impact of material use and cell manufacturing. Therefore, reducing material scrap or using renewable energy along the value chain can have a larger effect,” says P3.
Nevertheless, further optimisations will be made here too, even if they may not have a major impact on the carbon footprint of an individual battery cell. This is because the footprint of the production facilities cannot be ignored when it comes to the Scope 3 emissions of cell manufacturers and machine manufacturers.
Recycling: another CO2 factor
Since this text focuses primarily on the impact of battery production, we will only briefly consider the topic of recycling – the P3 analysis is much more detailed in this regard. CO2e emissions and recycling rates depend heavily on the process used. There is a wide range of possibilities, from 3.6 kg CO2e per kilogram of recycled material with a recycling rate of 70 per cent (mechanical pre-processing with hydrometallurgical treatment) to the worst case scenario of 12.8 kg CO2e/kg with a recycling rate of only 25 per cent (pyrometallurgical processing with hydrometallurgical treatment).
Overall, there are numerous levers that can be used to make battery production cleaner – and thus further increase the climate advantage of electric cars over combustion engines (and, of course, commercial vehicles). These include regulatory issues such as the battery passport, which has not been mentioned here yet and which helps to track supply chains and thus optimise emissions. The use of renewable energies in as many processing and production steps as possible, as well as in transport between them, is crucial. Innovative production methods can help to reduce the consumption of this clean energy, as can modern, efficient production machines built with secondary raw materials wherever possible. And recycling itself also generates (more or less high) CO2e emissions in the process, but it helps to reduce the carbon footprint of materials such as lithium and cobalt in the next generation of batteries.

“By adopting these strategies, the industry can achieve a fully sustainable battery value chain,” the P3 authors conclude. “Future considerations include assessing the emissions associated with gigafactory construction and evaluating alternative chemistries, such as solid-state and sodium-ion batteries.”
p3-group.com (whitepaper download)


0 Comments