P3 Charging Index: Which electric car charges best on long-distance trips?
Any claimed range or specified maximum charging power must be treated with caution when wanting to know how fast you’ll really progress on longer journeys with one or more charging stops.
Now, the engineering consultancy P3 Automotive claims its unique charging index gives electric car drivers a “real-life reference”.
* * *
At first, comparing electric vehicles appears straightforward enough as you could ask three simple questions: which battery offers more (usable) energy capacity, which has the higher standard range, and which car has the higher maximum DC charging capacity? But anyone who has ever driven an electric vehicle knows this comparison is not that easy at all. Standard consumption and claimed ranges are almost impossible to achieve in real-life, the maximum charging power is often only available in a limited scope, and many factors such as the temperature and the battery’s current state-of-charge (SoC) also influence the actual charging power.
However, P3 Automotive say they have developed the P3 Charging Index specifically for taking these difficulties into account. According to the consultants, two questions are particularly important when trying to compare different models from a driver’s, i.e. a real-life, perspective: How much range is required to reach the next stopover/ charging station or destination? And how long does the charging process take to reload this required range?
The index itself is a quotient of the actual recharged range within 20 minutes to the target value of 300 kilometres of recharged range. In other words: a car that reaches the ideal index value of 1.0 can recharge 300 kilometres in 20 minutes – and thus drive 600 kilometres with only one stop, given the battery is full at the start of the journey. P3 chose the value of 300 kilometres assuming typical long-distance drivers would take a short break at least every 250 to 300 kilometres anyway, says the firm.
But what are “real-life” values for charging power and consumption? To obtain a representative result in terms of charging power – that excludes both short-term peaks in charging power at very low State-of-Charges and the regulation of charging power at high charge levels – P3 calculates the average charging power in a “charging window” of 20 to 80% SoC. The calculated consumption relies on WLTP data, but P3 added a surcharge based on the ADAC Ecotest (the German Automobile Association) in each case to arrive at a more realistic value.

To illustrate the indexing method, let’s compare the results for the Porsche Taycan, VW’s ID.3 and the Tesla Model 3. To say it upfront, Porsche takes the lead with its Taycan EV. Although none of the here tested models reaches the possible ideal index value of 1.0, the Taycan comes closest to it with 0.72, followed by the VW ID.3 in the version with the largest 77 kWh battery with 0.7 and the Tesla Model 3 with 0.66 index points. We’ll explain why in a second.
Note first though, that both the Taycan and the ID.3 still miss the consumption values from the ADAC Ecotest, while the ID.3 also lacks a detailed charging curve as it is not yet available on the market. Commentators on our German outlet which first released the charging index, also noted that both the Taycan as well as VW’s electric car are not available in real-life yet. According to P3’s statements, however, the consultants based these estimates on their longstanding expertise. “If you look at the one or other place for announcements and values about Volkswagen’s charging behaviour, you can already identify the first anchor points,” says Christian Gehring, co-author and Senior Consultant E-Mobility at P3. “Of course, we will correct such estimates upwards or downwards with a new publication or measurements from our side,” he added.
Now to look at the current results in detail, the ID.3 with the (estimated) Ecotest values is still the car with the lowest consumption in the evaluation and can recharge electricity for 211 kilometres in the set 20 minutes.
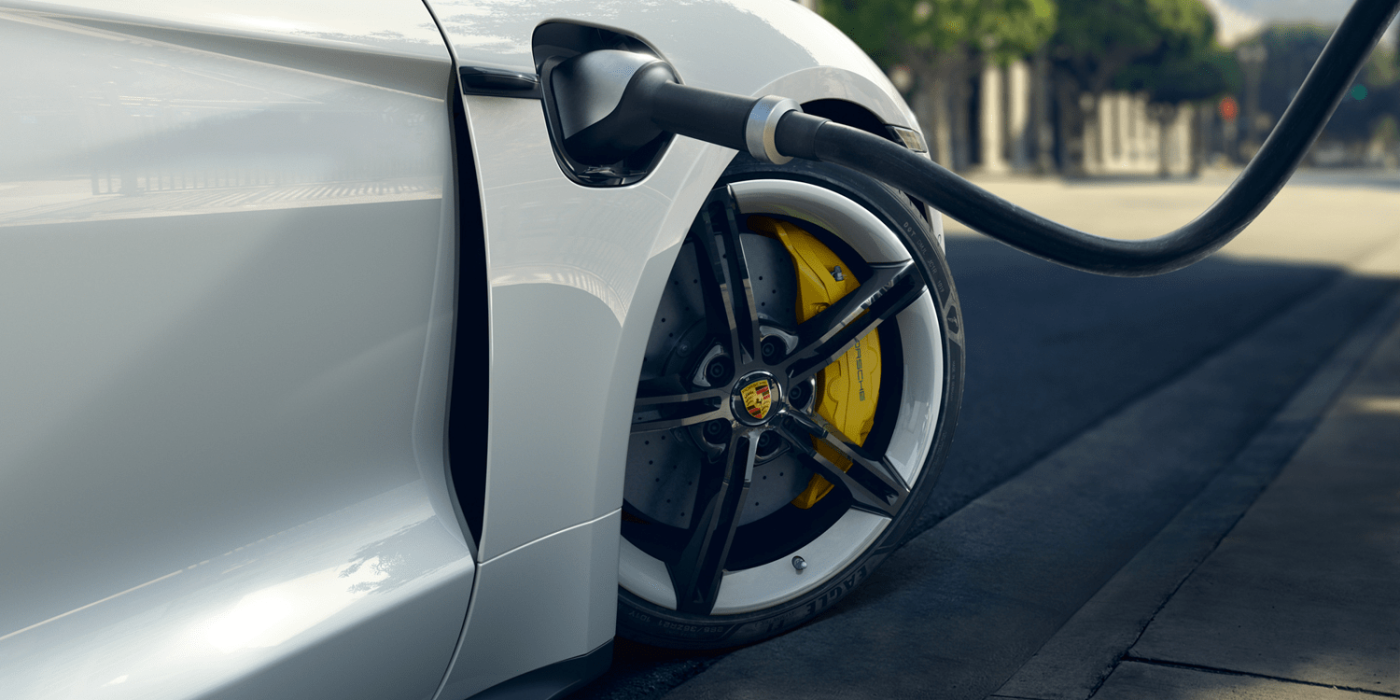
The fact that the Porsche Taycan is still ahead of the electric VW is mainly due to the high charging capacity of its 800-volt onboard system. At the same time, P3 set the consumption of the electric Porsche as the highest in the comparison. Of the maximum 270 kW specified by the manufacturer, P3 estimates an average of 224 kW to remain in the 20-80 per cent SoC charging window, translating to a range of 216 kilometres in 20 minutes. So despite the more than twice as high average charging power, the recharged kilometres are only slightly above the ID.3 level (-5km).
With regards to Model 3, Tesla enables 250 kW charging power with a Supercharger V3. However, these maximum values are available just outside the charging window looked at by P3. More so, the consultancy sees “the fastest reduction in charging power in the entire test field via the charging process” from Tesla – a fact that is mostly down to software and programming securing a longer battery life we may add. This means that in the comparison proposed here the Model 3 reaches an average charging power of “only” 128 kW. So while the Tesla can recharge an impressive 126 kilometres in the first ten minutes, the second half of the scheduled charging time only adds another 71 kilometres thus adding up to 197km recharged in 20 minutes.
For the P3 Charging Index, the consultancy has used top-trim variants of all electric vehicles and stresses that these comparative values indicate the long-distance suitability of electric cars. In future, P3 Automotive told us they plan more tests and to look at different cars segments in a more differentiated manner.
Press Information Charging Index (PDF)
>> With reporting by Sebastian Schaal, Germany.


2 Comments